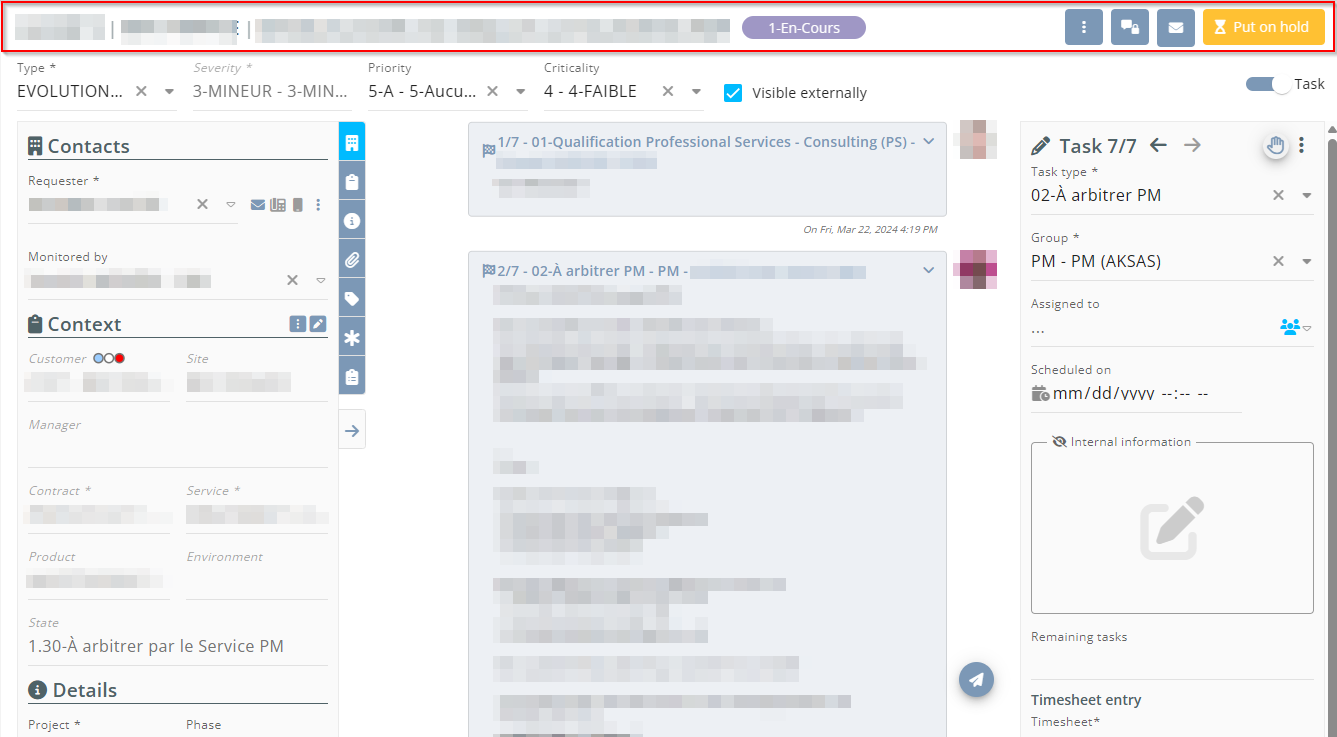
Description of the issue screen
The issue screen is split in 4 parts:
- At the top, the Header banner of the issue.
- On the left, the Context of the issue.
- In the middle, the Activity feed.
- On the right, a Task panel that can be shown or hidden. Managing tasks is not detailed in this chapter but in the chapter Tasks.
The header of an issue displays the main information of the issue:
| Title line | The number, the customer and the title of the issue. |
| Issue status | Hover over the status to show the tooltip that contains the date and time of status changes, for example Resolved on July 26, 2022 / Closed on August 2, 2022. |
| Customer score | Hover over the score to show the tooltip that contains the related comment. |
| Alert or blocking when call taking |
If an alert is set on the customer when call taking, the If the customer is blocked from call taking, the Reference For more information about the blocking, see Setting up blocking rules. |
| Type, Severity, Priority and Criticality |
The nature, severity, priority and criticality of the issue. Those fields can be modified directly from the header. If the severity is modified and corresponds to an alert set up on the maintained product linked to the issue (from the Desktop Application > Help Desk > Maintained products > Alert on issue tab), a window will be displayed when saving modifications. This window displays the Alert message specified from the Desktop Application and allows the creator of the issue to answer it. The alert will then be visible from the activity feed. Note If the |
| Visible externally | If the box is checked, the issue is displayed in the Customer Portal. |
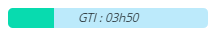
| GRT and GFRT deadlines |
The GRT and GFRT deadlines are set up from the Desktop Application, in Help Desk setup > Issues and tasks > Service Level Agreements (SLA). Those deadlines are then associated with the service on the customer contract, depending on the severity of the issue. The deadline gauges are only displayed if the corresponding counter is set up. If there are no GRT or GFRT deadlines set up, the gauges are not displayed. The gauge color indicated the deadline state:
Tip Hover over the GRT or GFRT gauge to display as a tooltip the various information about each contract detail: reception date, opening date, commitment time, etc. |
 icon is displayed in the header of the issue and a message is displayed when opening each issue of this customer.
 icon is displayed in the header of the issue and a message is displayed when opening each issue of this customer.
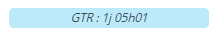


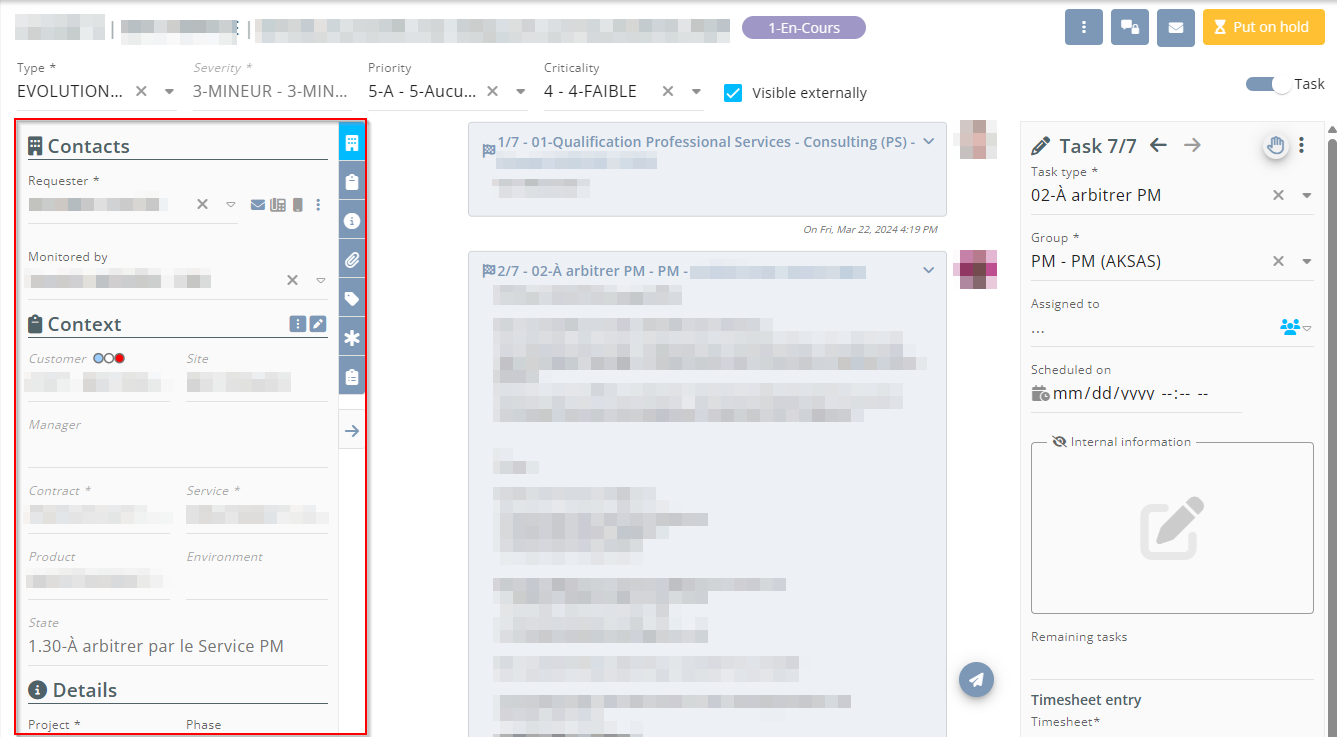
The context panel displays all information related to the issue and its context, divided into sections.
The panel width adapts itself based on the width of the browser window. The panel can be displayed in three ways:
- Reduced display with sections in a column. In this display, click on an icon at the top right of the panel to access the relevant section.
- Intermediate display with sections on a column but the fields are displayed on multiple columns.
- Large display with sections and fields on multiple columns.
To go from one display to another, click on the  and
and  arrows on the right of the panel.
| Section | Description |
|---|---|
| Contacts |
The Contacts section displays the contacts related to the issue: the requester, the user and the person who monitors the issue. These contacts can be modified directly from the context panel. The Restrict to site contacts filter Those actions are also possible:
|
| Context |
The Context section displays information specified for the context input of the issue: customer, contract, service, etc. This information cannot be modified directly from the context panel but from a specific feature (Modifying the context of an issue). From the
The color indicators set up from the Desktop Application are displayed in the Customer field. Hover over each indicator to display the label as a tooltip. Those indicators are set up from General setup > Sales > Customer color option management and are applied on each customer's record sheet. Those colors give additional information on customers and their meanings are specific to each company. If an alert memo has been specified for the contract and/or the service, the
|
| Information |
The Details section give additional information on the context of the issue: allocation, revisions, domain of application, etc. This information can be modified from the context panel. On the Corrective revision field, the |
| Linked documents |
The Linked documents section regroups the documents linked to the issue, for example a screen shot or a log file. There are two types of documents: external documents that are linked to the issue and that can be viewed by customers, and internal documents that are hidden from the Customer Portal and that can only be used internally. For more information, refer to Managing linked documents. |
| Linked tags |
The Linked tags section is used to manage tags associated with the issue. Tags make it possible to search for and filter issues with multiple criteria that can be customized to your needs. Tags are set up from the menu General setup > Cross-cutting > Tags. For more information, refer to Managing tags. |
| Custom data |
Custom data displayed in the Custom data section of the context panel is data added in quick access. This data can be specified and modified directly from the context panel. The entirety of custom data is accessible and modifiable from a specific feature. For more information, refer to Managing custom data. |
| Customer response |
The Customer response can be freely specified and is visible by the customer from the Customer Portal. Click on the text field to open the window, specify the customer response and click on Validate. When the customer response is already specified, click on Tip In this field, you can insert table texts and rich text (refer to Using table texts and Using rich text). |
 at the right of the Requester and User fields allows you, when enabled, to filter the help list in order to only suggest contacts linked to the site specified in the Site field. When disabled, the help list suggests all contacts linked to the company without any site distinction.
 icon next to the title section, the following options are available:
 icon is used to specify the latest revision linked to the version of the revision to be corrected. The icon is hidden when the corrective revision is already specified.
 then Save if you want to delete this customer response.
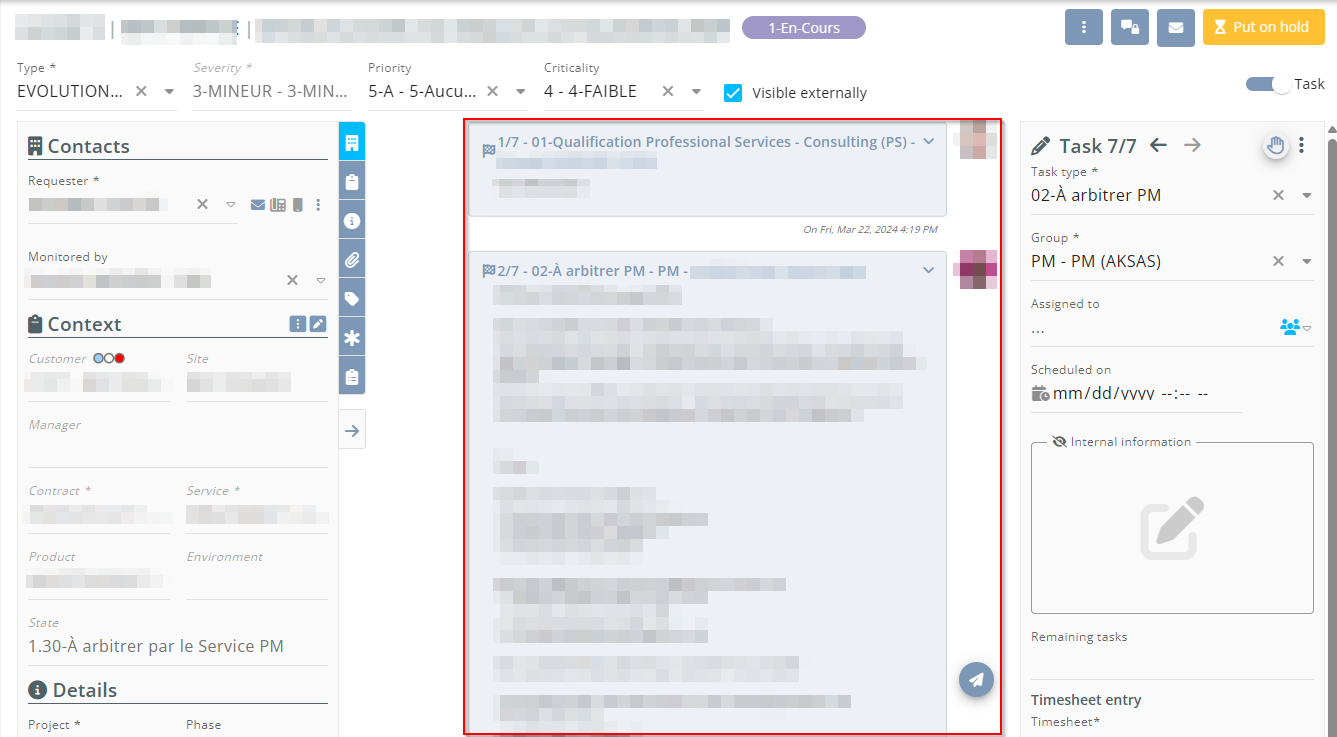
The activity feed displays, in chronological order from oldest to newest, all actions done on the issue: tasks, direct messages, issue put on hold, linked documents, etc.
The description of the issue is always the first entry of the activity feed. Click on  to modify the description then on Save to take modifications into account.
Tip
In this field, you can insert table texts and rich text (refer to Using table texts and Using rich text).
After the description, various tasks and direct messages of the issue are displayed, one after the other. Actions done internally are displayed on the right of the activity feed and actions from the customer are displayed on the left.
Color coding allows you to quickly identify each element of the issue:
- The description and customer direct messages are displayed in purple.
- Internal direct messages and messages informing the issue is on hold or resumed are displayed on a white background.
- Tasks are displayed on a gray background. Completed tasks are identified by the
 icon and tasks in progress by the
  icon. Click on a task in the activity feed to open the details of this task in the Task panel.
 - If an alert on issue is ongoing for the issue, a red Alert on issue message is displayed in the activity feed. This message displays the Alert message specified for the alert and the response provided. If the alert is no longer ongoing, the message can still be seen in the activity feed but it is displayed on a white background.
For each action, the following elements are available:
- The user or the customer contact behind the action.
- The action date and time, or the last modification date.
- The title of the action and the content. Click on
 at the top right of each action to fold or unfold the visible information.
Documents added are also visible with the user, the customer name if the document was added from the Customer Portal, the uploading date/time, and the title of the document. The following actions are possible:
- If it is an image or a PDF, click on
 to download the document.
 - If it is a link, click on it or on
 to open it in a new tab.
 - If it is a document different from an image, a PDF or a link, click on or on the name of the document to download it.


