You can quickly find information in your company's database thanks to Akuiteo's search engine.
When you open a menu for example, search and display screens are the first screens you see.
By default, these screens are empty when you display them.
In this type of screen, the user must specify information to start a search. These screens give a direct access to the searched pages.
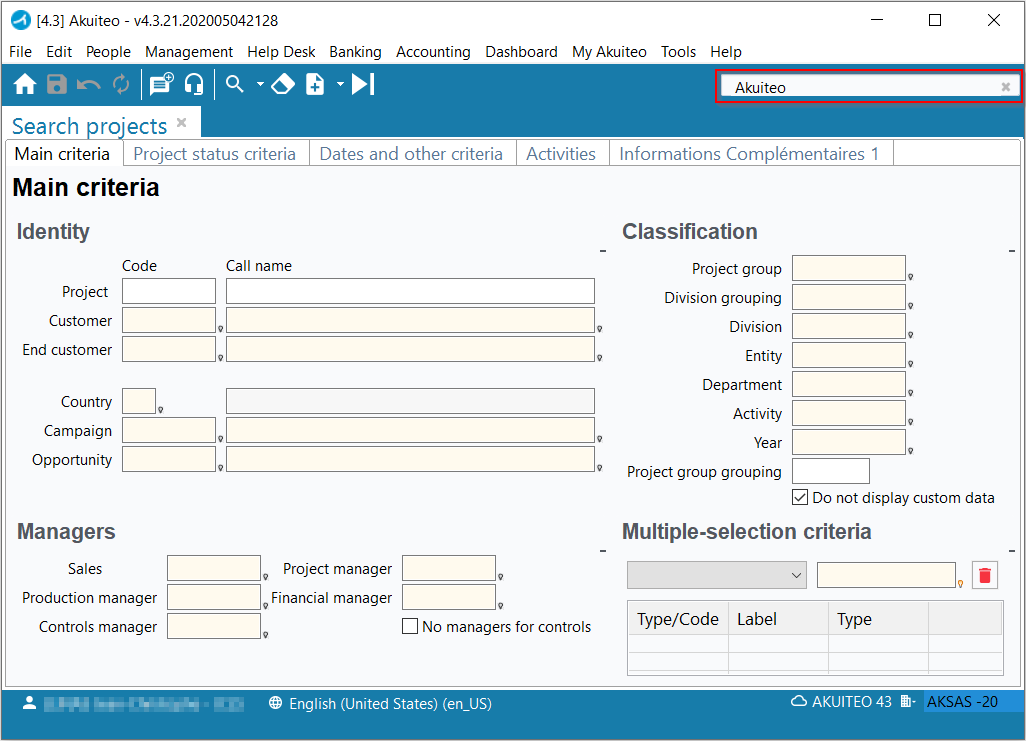
Let's start a customer search for example. From the menu bar, go to People > Customers/Prospects to open the search screen.
Additional tabs enable you to add specific information to your search.
There are several types of fields:
Free-form fields
Free-form fields are input boxes where the user can specify text. Their default color is white but they turn blue when they are active.
Non-modifiable fields
Some object fields cannot be modified. They can only be filled in when creating an object. These fields are always shaded.
Fields generated from a help list
You can set up help lists to use them later:
To use these lists from a search screen:
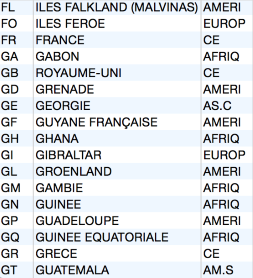
- search for light-orange input fields. These fields become yellow when they are active and can be identified by a small bulb icon.
- use a special character, like ?. This character can be modified in the user preferences.
- if you want to filter a help list, you can specify part of your search with the "?" character. e.g. 2244? or ?2445 or 22?45 or ?244? for a list of ZIP codes. You can also filter the data containing a value such as ?marc?, for example.
- use the Enter, Tab or F2 keys to display the help list.
If a table is displayed below a field with a help list, it means it is a multiple-criteria field that enables you to select multiple lines:
- press and hold the Ctrl key when selecting data, then press Enter.
The lines are displayed in the table.
Date fields
To specify date-type fields, click on  to select the desired date from the calendar.
The date can also be manually specified, with 2, 4, 6 or 8 numbers:
| 2 numbers | The 2 numbers specified define the day. The current month and year are automatically filled in. |
| 4 numbers | The 4 numbers specified define the day and month. The current year is automatically filled in. |
| 6 numbers | The 6 numbers specified define the day, the month and the last 2 digits of the year. The year is automatically filled in. |
| 8 numbers | The 8 numbers specified define the full date. |
Note
Dates can be specified with or without the "/" separator.
The following shortcuts can also be used to specify the date:
- With the cursor in the empty field, press the top arrow (or move the mouse wheel upward) to specify tomorrow's date.
- With the cursor in the empty field, press the down arrow (or move the mouse wheel downward) to specify today's date.
- When a date is already specified, put the cursor on the day, month or year then press the top or down arrow (or move the mouse wheel upward or downward) to add or remove a unit.
- specify directly yesterday, today and tomorrow to respectively specify yesterday's, today's and tomorrow's dates.
Hyperlinks
These links allows you to access the highlighted object without closing the displayed screen. They allow you to:
- open an object's record sheet in a new tab (e.g. the customer module),
- open a web page in a new tab (e.g. a customer's website),
- open a window (e.g. a project code).
You want to retrieve the list of customers starting with the letter C:
| 1 | In the Call name field, specify C?, then press Enter. A list with several results is displayed. |
| 2 | In this list, double-click on the relevant line to open the customer's record sheet. |
Tip
From the cell of a line of search result, right-click on it and select Copy cell to copy this value in the clipboard.
Note
If there is only one result matching, the searched screen is automatically displayed.
Creating graphs
| 1 | From the search results, click on  in the action bar to switch to graph mode. in the action bar to switch to graph mode. |
| 2 | In the window, specify the following fields to define the graph data: |
| Field | Description |
|---|---|
| Measure |
Select the value to be measured from the drop-down list. This list contains all the columns available in the search results, including custom data. Example You want to measure the pre-tax amount billed for the year 2018, on a month-to-month basis. From the invoices search results (from 01/01/2018 to 12/31/2018), you switch to graph mode. In the Measure field, you select Subtotal EUR. |
| Operation |
From the drop-down list, select the arithmetic operation to apply to the measured values — the values of the column selected in Measure. The following operations are only available for numeric values:
The following operations are available for numeric and non-numeric values:
Example You want to measure the pre-tax amount billed for the year 2018, on a month-to-month basis. In the Operation field, select Sum to add up all pre-tax amounts in invoices. |
| In thousands | Si la case est cochée, les valeurs mesurées seront affichées en milliers (arrondies à l'entier le plus proche). |
| By |
From the drop-down list, select the measure to compare with the previous one. This list contains all the columns available in the search results, including custom data. If the selected column has a "date" format, the Grouping field is displayed to indicate the date format. Example You want to measure the pre-tax amount billed for the year 2018, on a month-to-month basis. Select Date in the By field. |
| Grouping |
The grouping only displays if the column selected in the By field has a "date" format. Select the date format in the drop-down list — Date time or Week of the year, for example. Example You want to measure the pre-tax amount billed for the year 2018, on a month-to-month basis. In the Grouping field, select Month of the year to categorize measured values according to the months of the year 2018. |
| Graph title | Specify the graph title. A title is automatically displayed with the information selected for the graph. This title can be modified. |
| Graph |
Click on an icon to define the type of graph to use. In Akuiteo, a graph can be displayed in four ways:
|
| 3 | Click on Validate. |
 Data selected from the search results are displayed as a graph.
Managing graphs
From the results in graph mode, click on  to switch back to table mode. Similarly, click on from the results in table mode to switch to graph mode.
Click on  to open the Graph window. The fields are filled in with the graph's current values. You can change these values and click on Validate to directly update the graph and the measured data.
Click on  to export the graph. Three options are available:
- Save as: to save the graph on your computer in .png format.
- Copy image: to copy the graph to the clipboard in .png format.
- Print: to print the graph.
Tip
From all graph types, click on a measure to open a new window with a table including all information about the data.
For example, from a bar graph, click on one of the bars to open the associated search results in a new window.
Note
Results from a saved searched can be saved in graph mode in order to directly display the results in a graphic form when the search is launched. This type of saved search can also be added as a widget on the home page.
Magnifying glass icons are displayed at the bottom right of the screen. These are shortcuts to search results.
There are several ways to close search results:
- Right-click on a magnifying glass and click on Close.
- Click on the cross in the search tab.
- Right-click on a tab's cross to close all the results or other search results.
It is recommended to avoid opening several searches at the same time to prevent slowing down Akuiteo's performance.
A display screen can be accessed after a search. You can notice the following elements:
- Fields are shaded and cannot be modified.
- You can click on social media icons or on interactive maps to display further information about your customer.
- Icons are available in the menu bar to allow you to modify the record or create a new one at anytime.
- To close a display screen, you just have to click on the cross in the screen tab or right-click to close several screens in a row.
Akuiteo provides an indexing tool that allows you to search for data within your ERP software.
All you need to do is to type your search in the relevant field to get the list of management objects and documents linked to your search.
Types of files that can be indexed
In addition to akuiteo objects, you can index the following documents:
- HTML, HTM
- XML
- TXT
- RTF
- DOC, DOT, DOCX, DOCM,
- ODT, ODS, ODP, ODG
- XLS, XLT, XLA, XLSX, XLSM, XLTM
- PPS, PPT, POT, PPA
- PPTX, POTX, PPSX, PPTM, POTM, PPSM
- SQL
From all Akuiteo screens
| 1 | Specify text in the Desktop Application's search field, at the top right of the screen. |
| 2 | Press Enter. The linked objects list, documents or any other indexed element is displayed. |
| 3 | Click on the entries on the left to filter the content according to your selection. These categories of objects on which you can click enable you to filter the view on the right. After clicking on Akuiteo Objects, you notice that you can click on Type then Document. |
| 4 | Double-click on the element to open. |
Reminder: results are filtered according to users' access rights (DMF).
From the New issue screen
| 1 | Go to Help Desk > New issue. |
| 2 | In the New quick issue field, specify the element to search for among the following ones: |
- Customer
- Contact
- Contract
- Product
- Site


